By Sydney Winstead
•
June 29, 2026
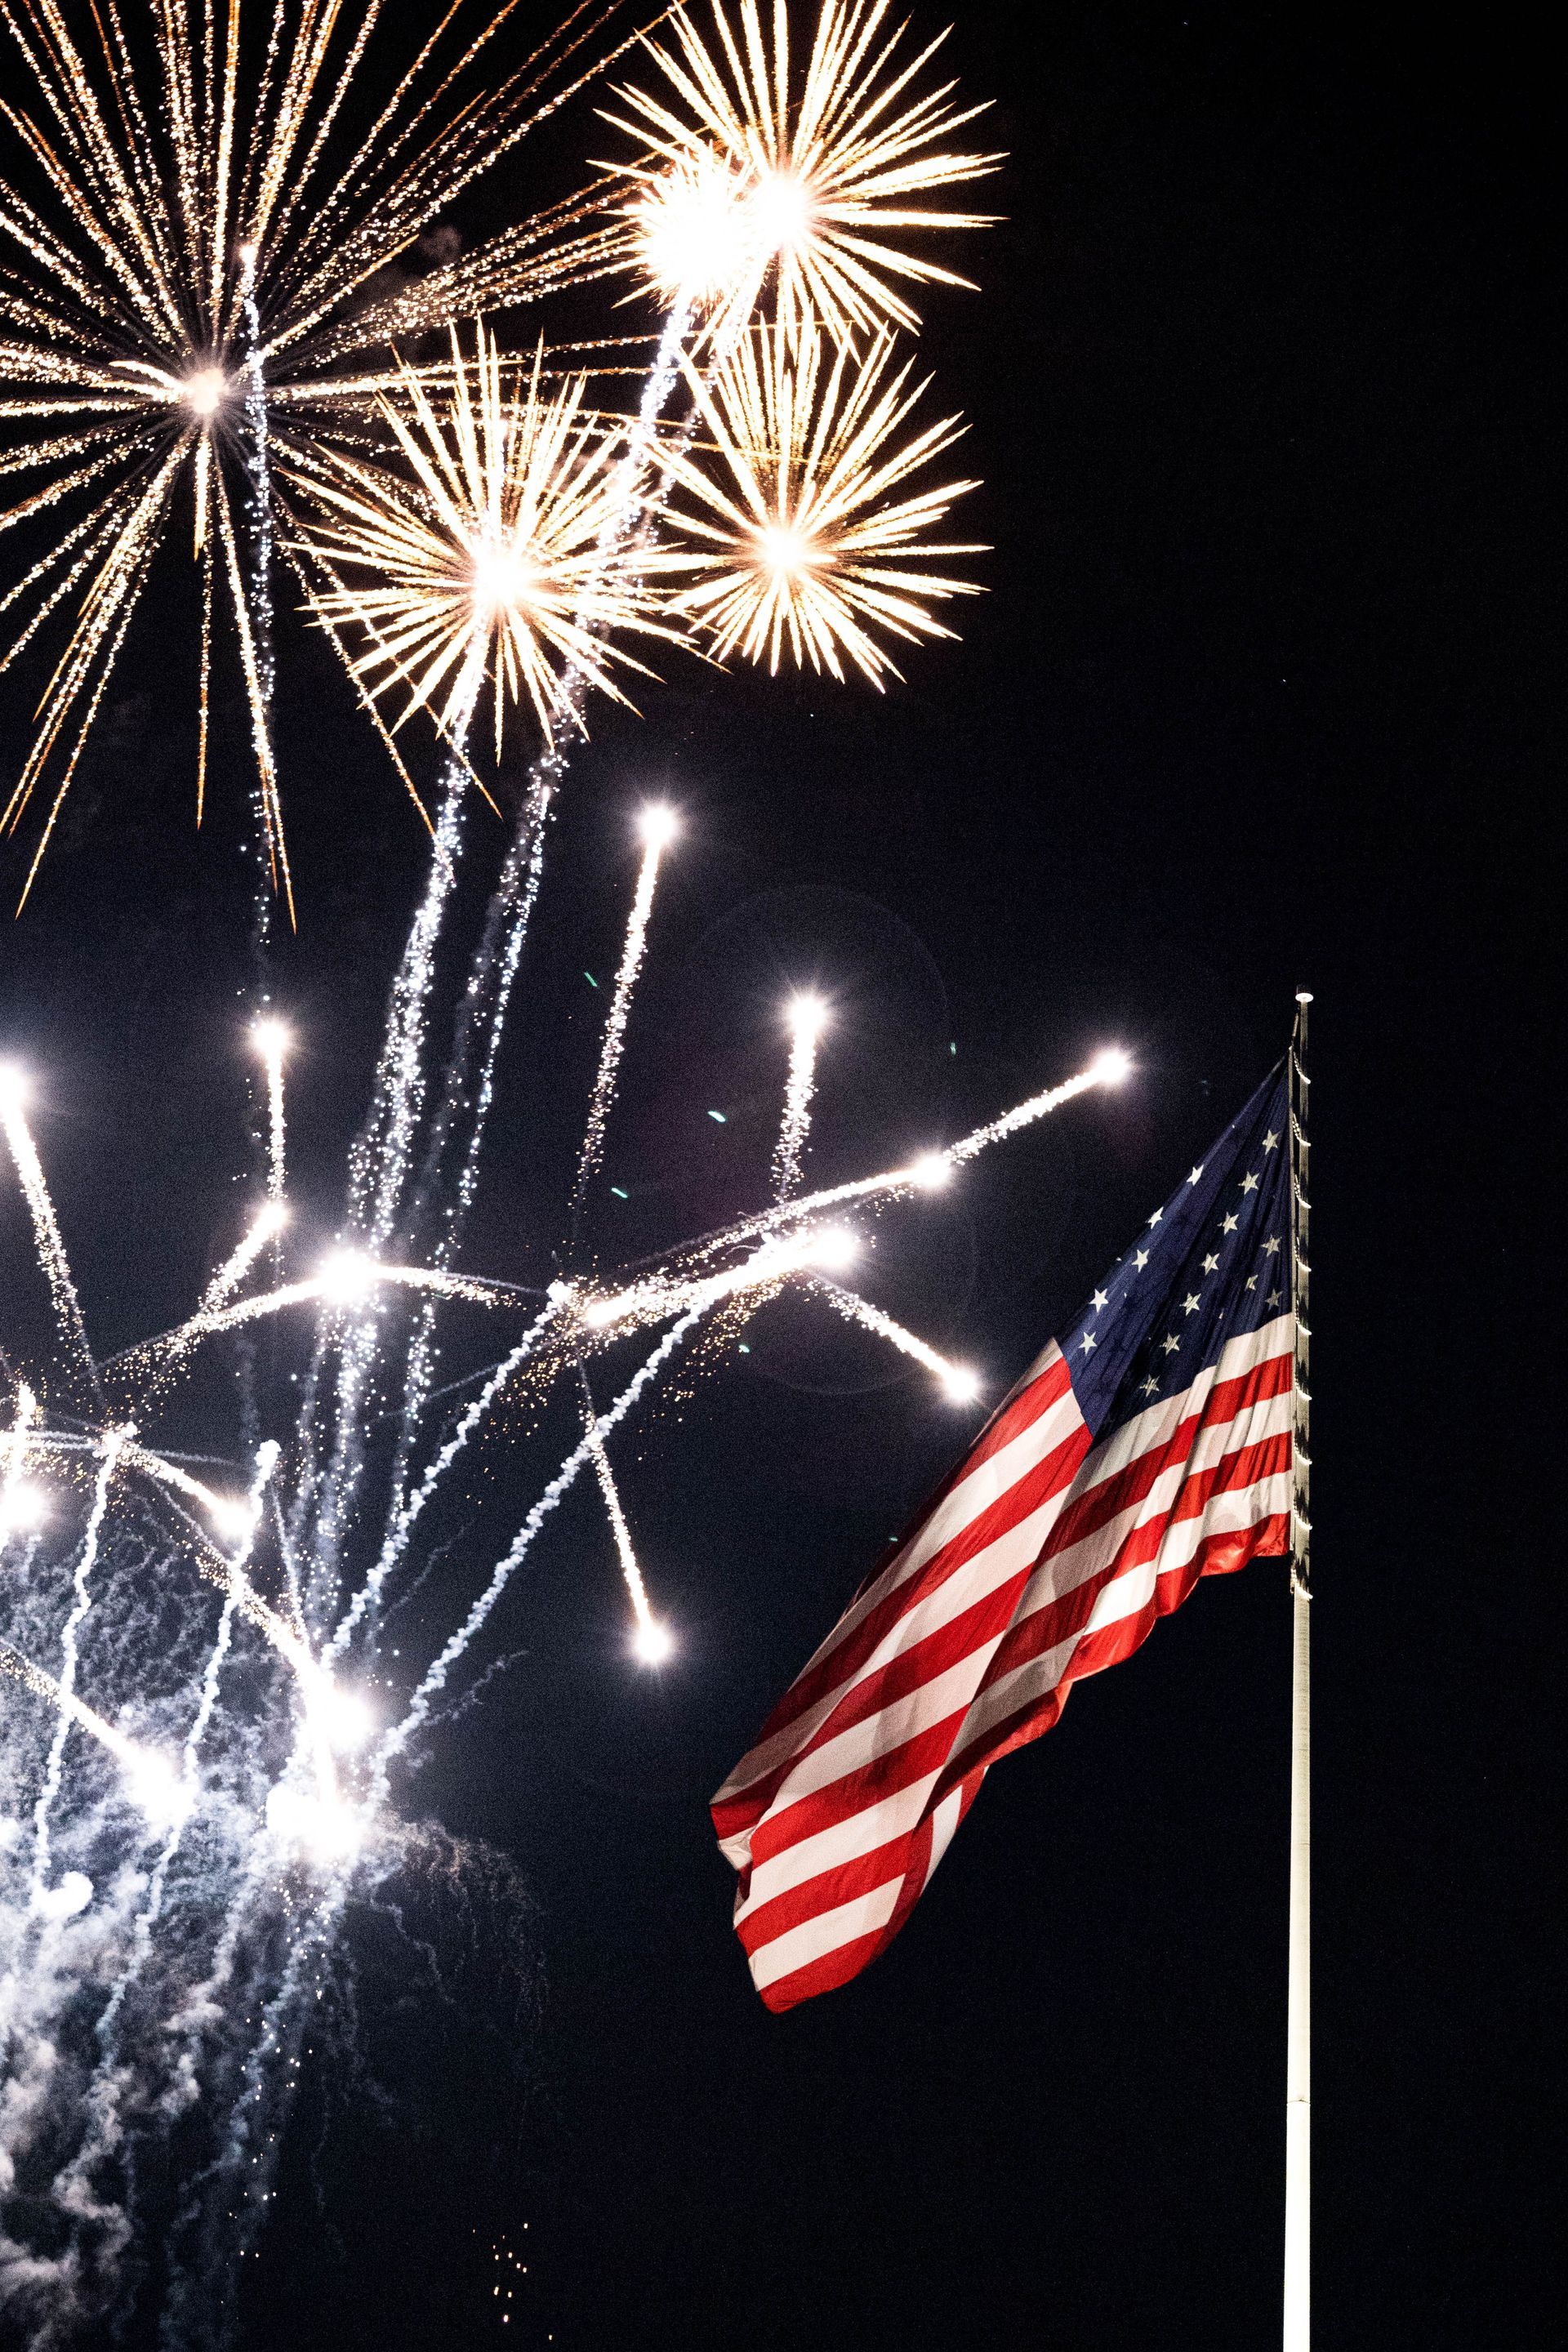
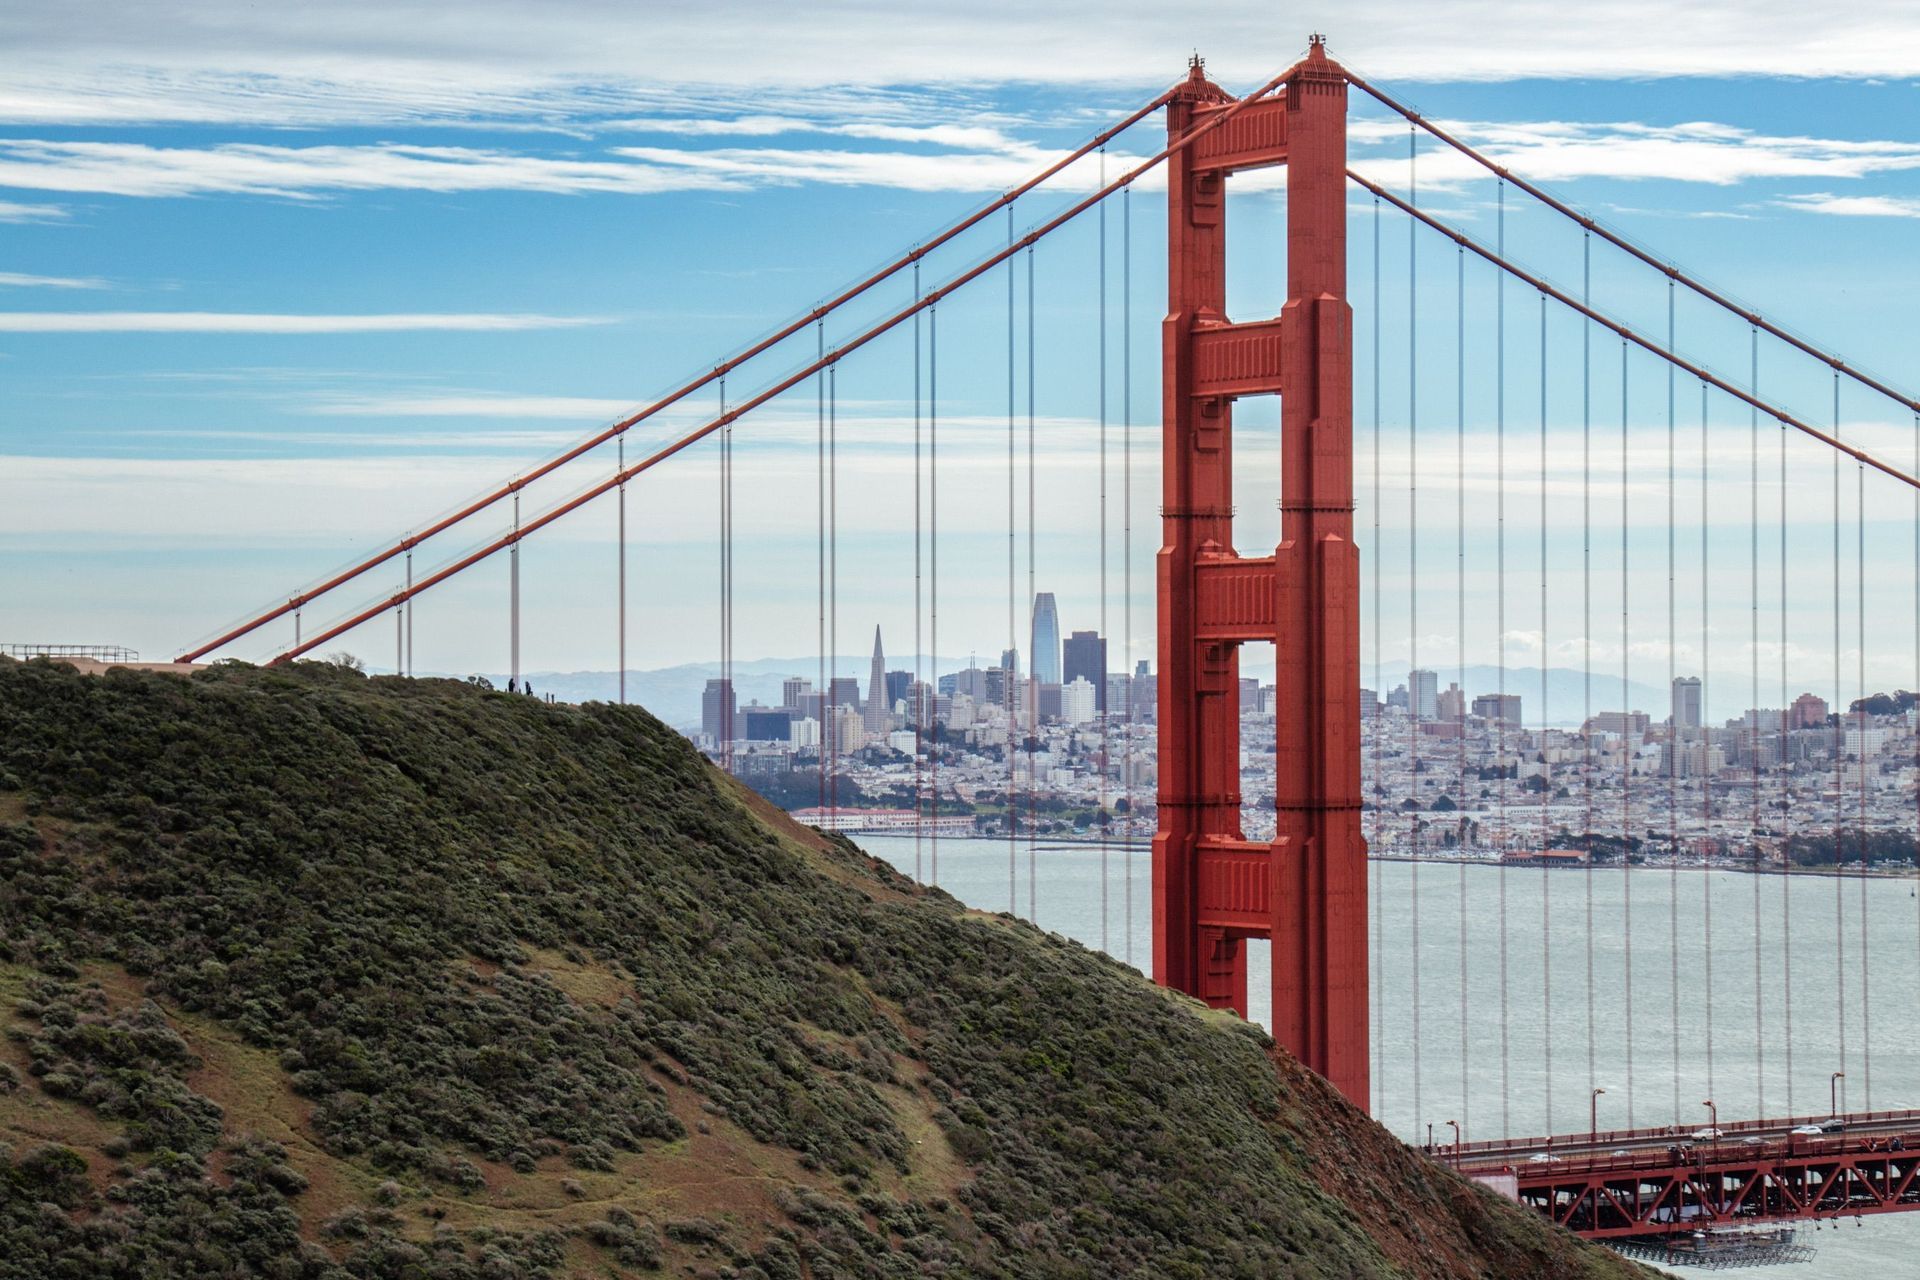
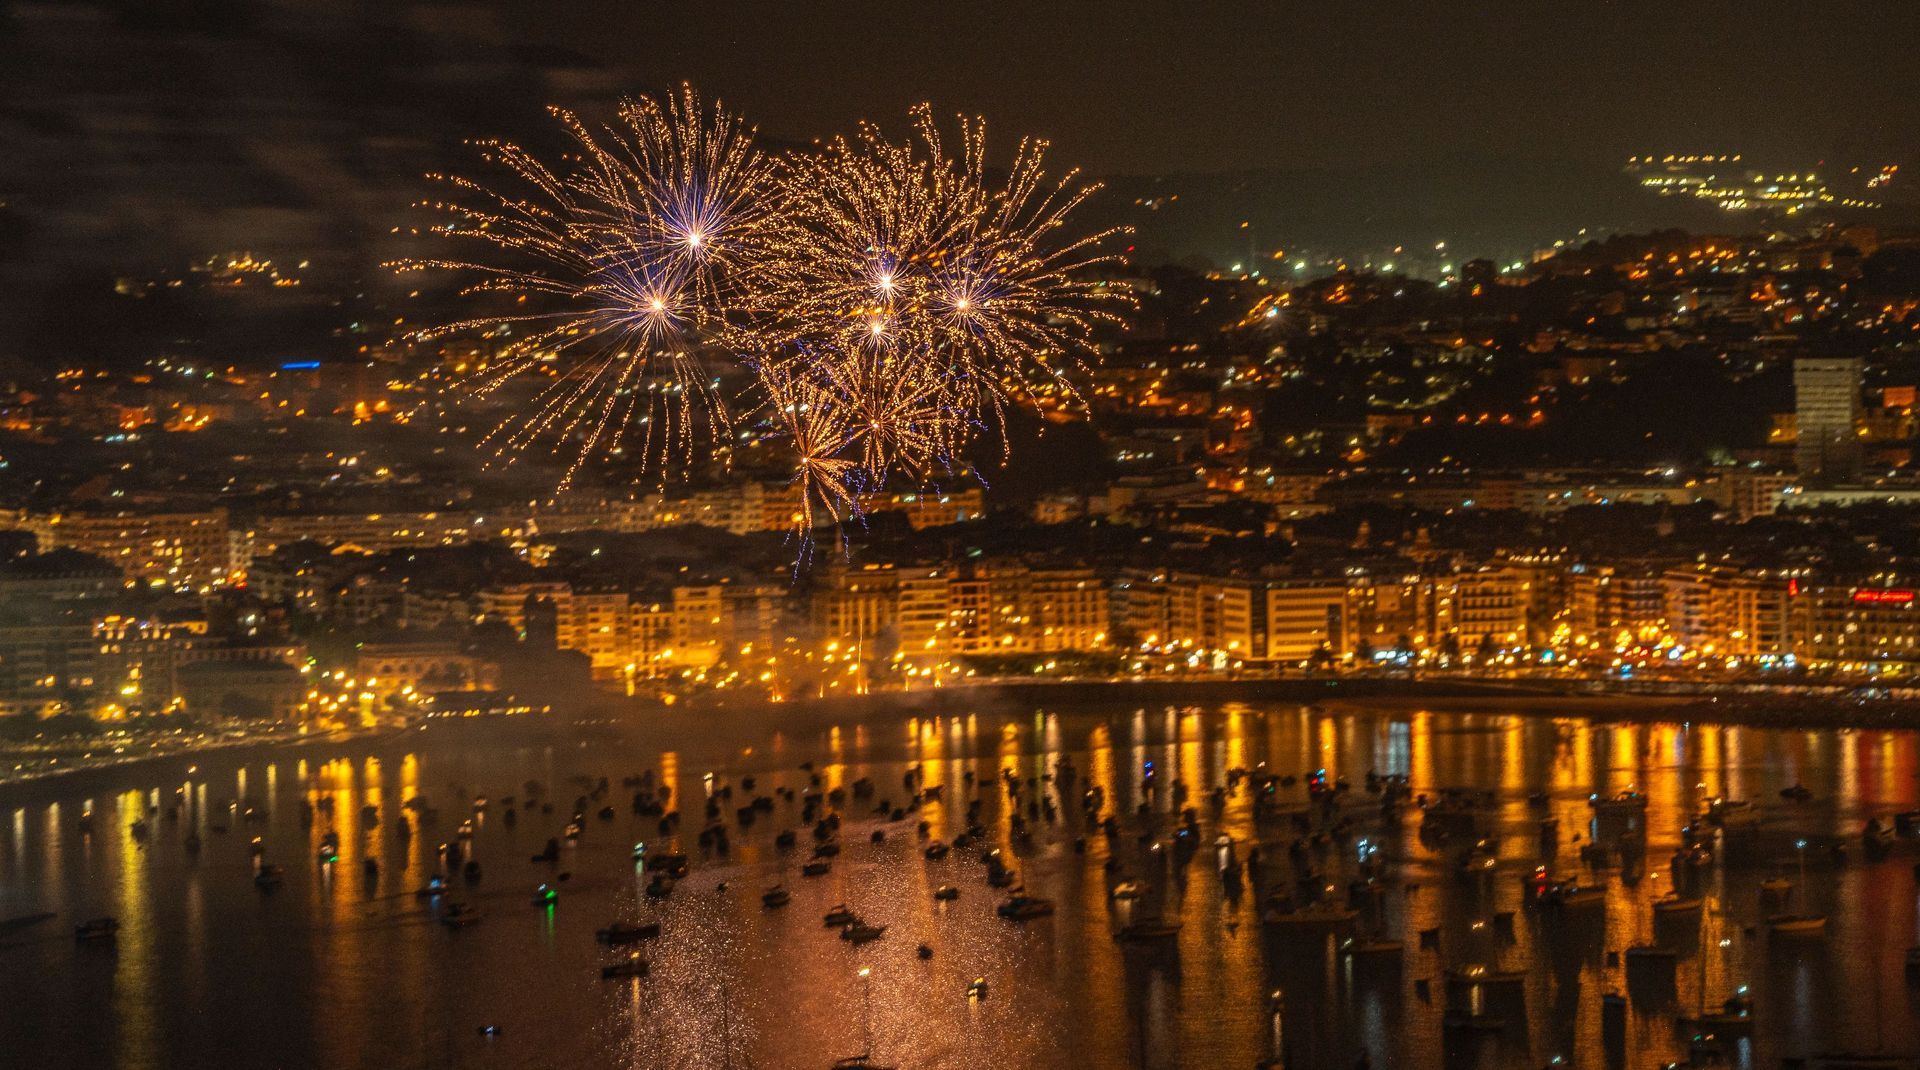
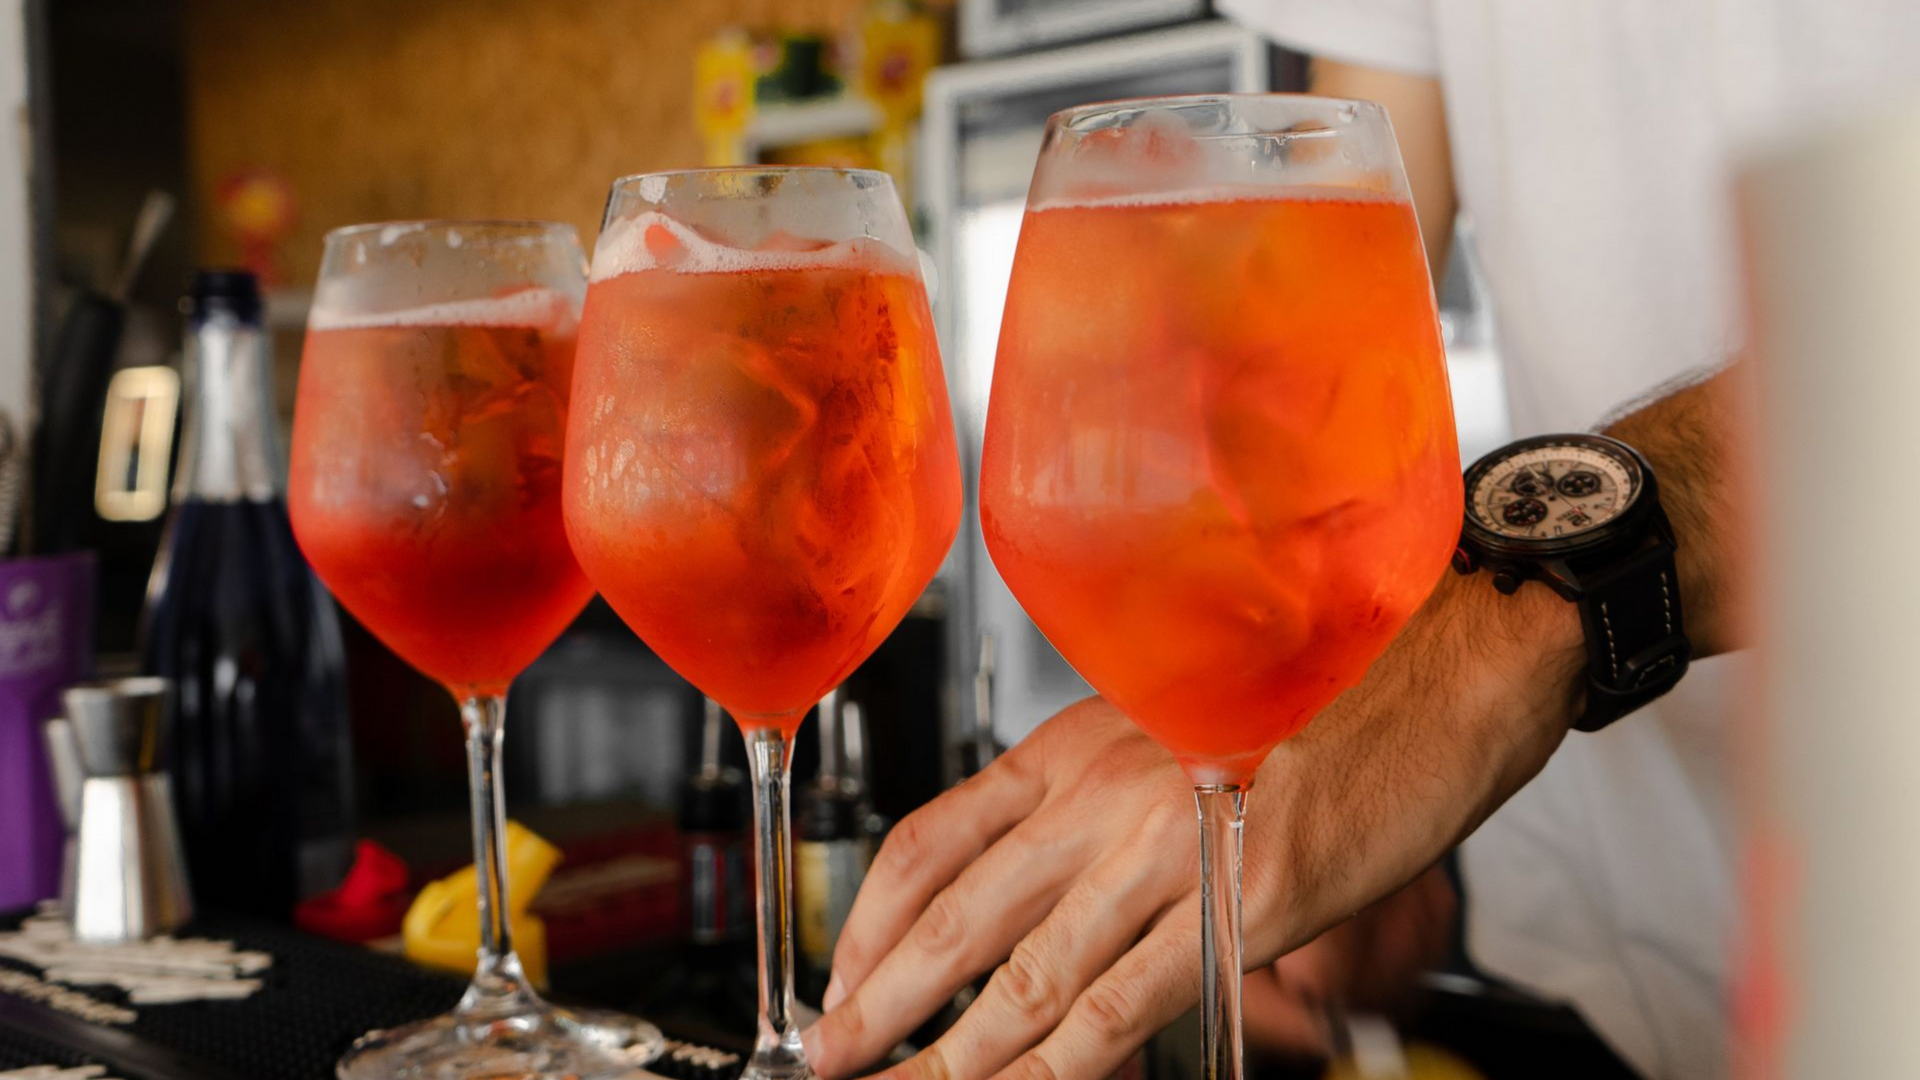
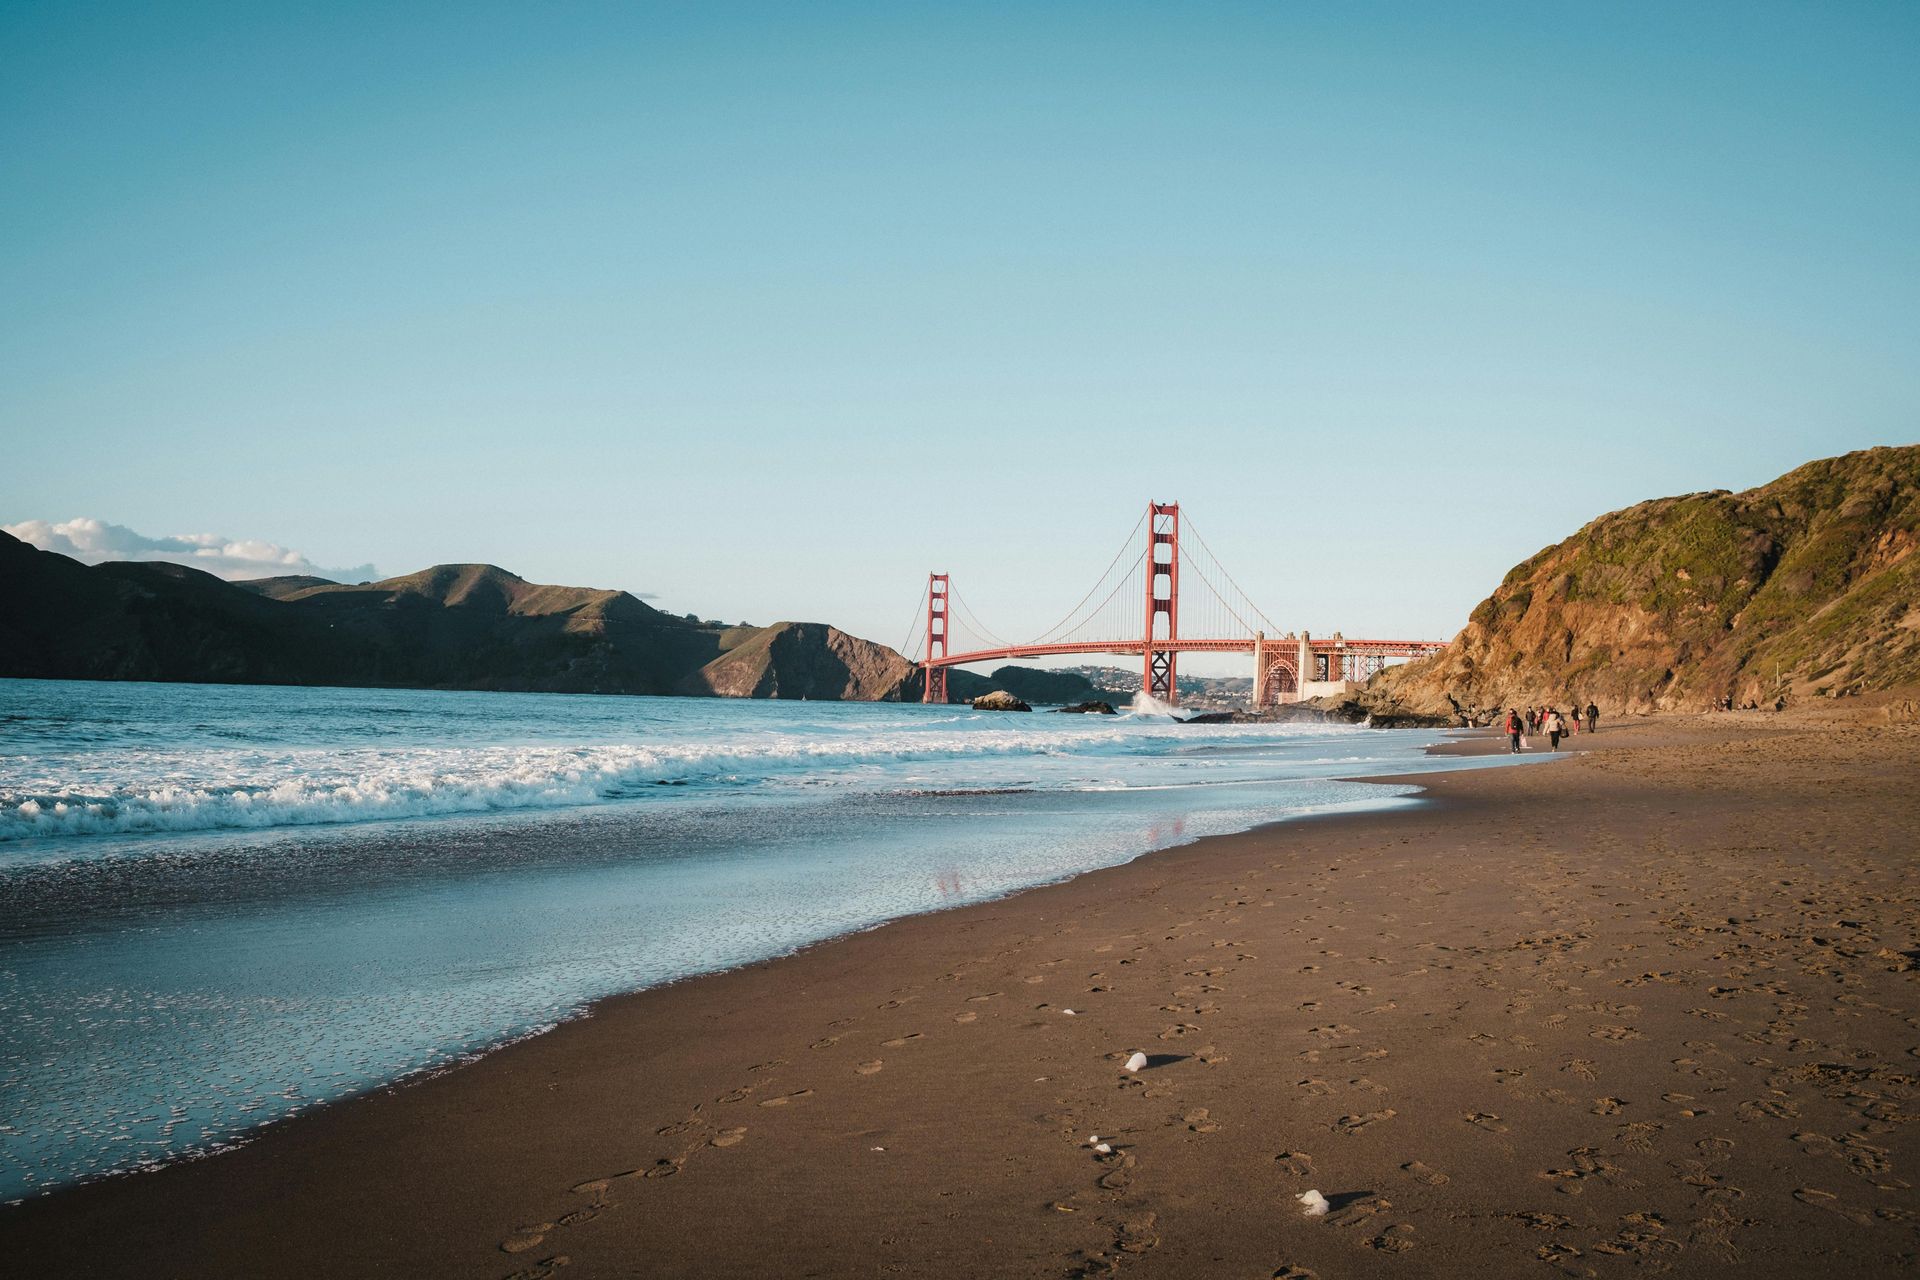
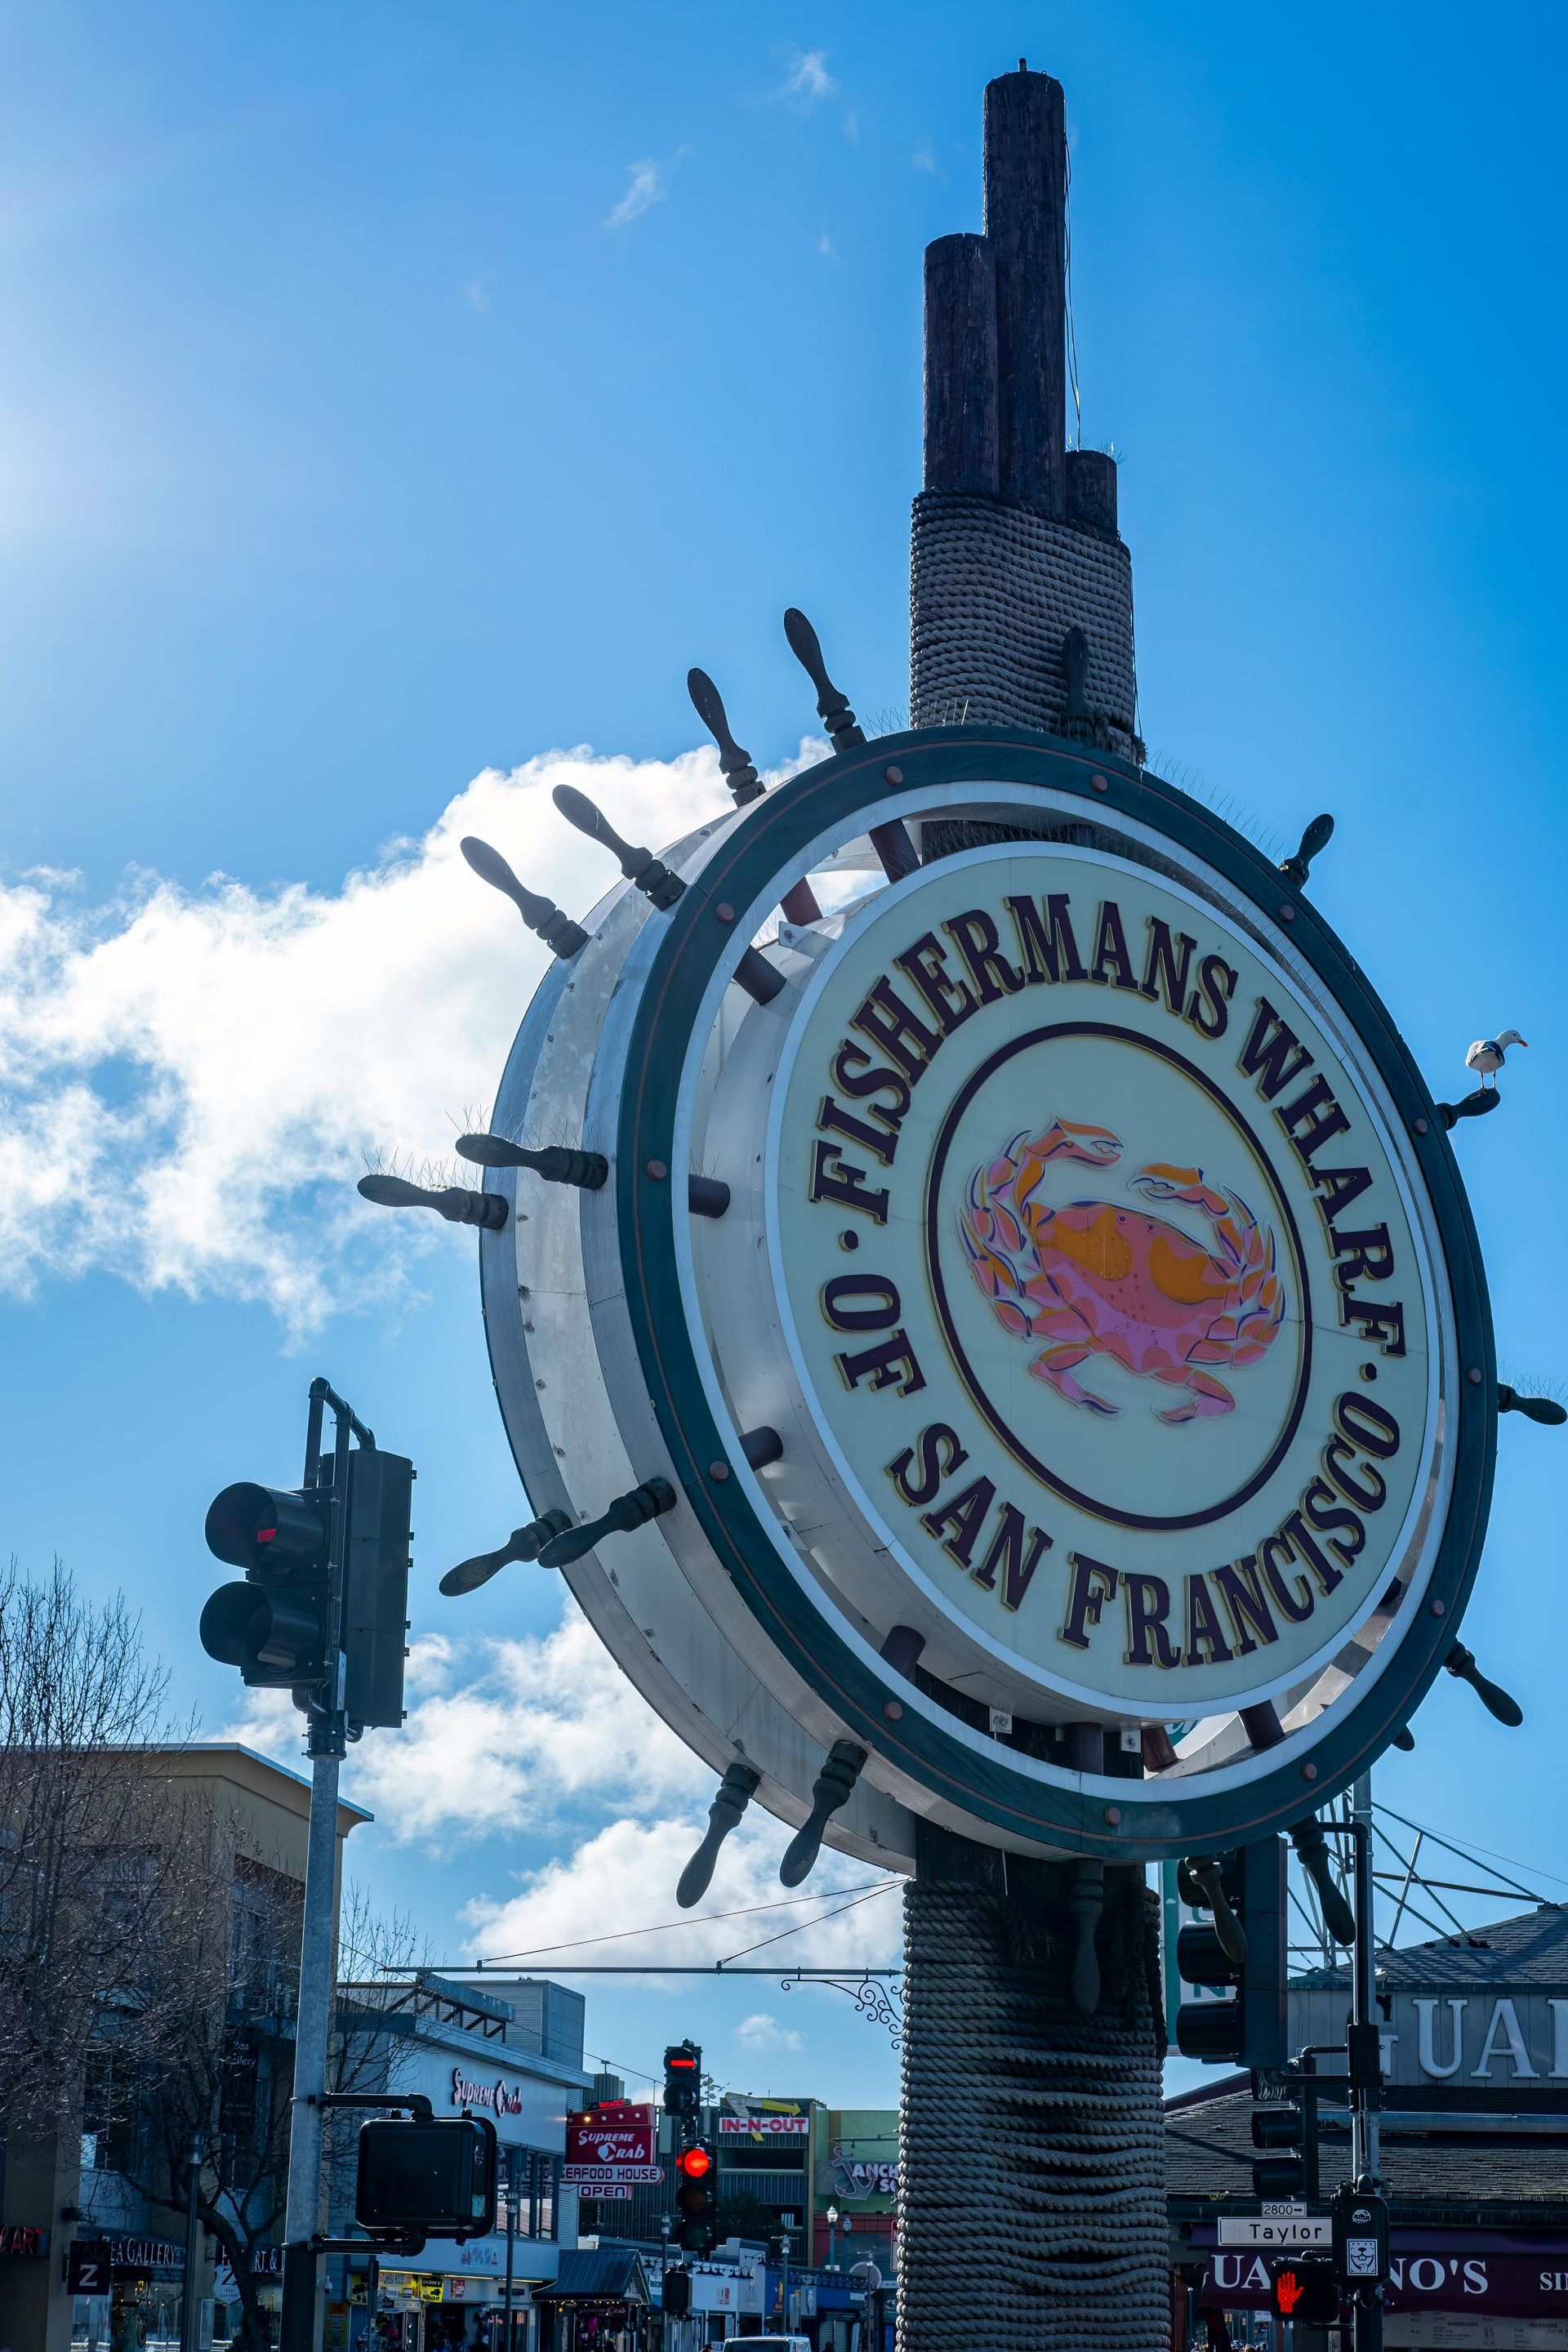
Fourth of July Events in San Francisco & the Bay Area (2026) Looking for the best ways to celebrate the Fourth of July in the Bay Area? From waterfront fireworks and hometown parades to live music, food vendors, and family-friendly festivals, there's no shortage of ways to enjoy Independence Day. Whether you're staying in San Francisco or exploring nearby communities, here are some of the top celebrations happening this year. San Francisco Fourth of July Celebration This year, San Francisco's official Fourth of July celebration will feature a spectacular fireworks display over the Golden Gate Bridge, marking America's 250th anniversary. The show begins at 9:30 p.m. and will be the city's only official fireworks display. Before the fireworks, visitors can enjoy a full day along the waterfront with live music, shopping, dining, and entertainment at Pier 39, Fisherman's Wharf, and Aquatic Park. Best places to watch the fireworks: Crissy Field Pier 39 Fisherman's Wharf Northern Embarcadero Marin Green Tip: Arrive early and bring a jacket—summer evenings along the bay can be chilly. North Bay Celebrations If you're looking to venture outside the city, the North Bay is packed with classic Fourth of July traditions. Sausalito Spend the day enjoying a community parade through Old Town, followed by a picnic, live music, food vendors, and an evening fireworks show over the waterfront. Sonoma Watch one of the area's favorite hometown parades before enjoying food, games, and local nonprofit booths around the historic plaza. Fireworks wrap up the festivities in the evening. Napa Downtown Napa starts the day with a festive parade before transitioning into an afternoon festival featuring live entertainment, food vendors, and a nighttime drone show over Oxbow Commons. Calistoga Celebrate with a morning parade followed by an evening laser light show complete with music and immersive visuals. East Bay Favorites Communities throughout the East Bay are hosting celebrations perfect for all ages. Popular events include: Alameda – One of the Bay Area's largest Fourth of July parades. Pleasant Hill – Firecracker 5K, family activities, parade, and evening fireworks. Concord – Pancake breakfast, parade, festival, and fireworks. Richmond – Waterfront celebration with live music, food vendors, and fireworks. San Pablo and Pinole – Family-friendly celebrations featuring drone shows instead of traditional fireworks. South Bay & Peninsula Events There are plenty of opportunities to celebrate throughout the South Bay and Peninsula. Highlights include: San Jose – The Rose, White & Blue Parade followed by a community festival. Morgan Hill – Freedom Fest featuring races, a parade, classic cars, live music, and one of the area's largest fireworks displays. Sunnyvale – Carnival rides, food trucks, live entertainment, and family activities. Half Moon Bay – Pancake breakfast, parade, and downtown festival. Palo Alto – Summer festival with food trucks, games, live entertainment, and its annual chili cook-off. 🎶 Live Music & 4th of July Entertainment Looking for more than fireworks? Many Bay Area communities are celebrating with live music, food vendors, and family-friendly entertainment throughout the day. ILLUM Block Party at The Midway Looking for a high-energy way to celebrate the Fourth? Head to The Midway for the ILLUM Block Party, featuring electronic music superstar deadmau5 alongside Nero. The outdoor and indoor festival runs from 3:00 p.m. to 10:00 p.m. and is one of San Francisco's biggest Independence Day parties for EDM fans. This is a 21+ event, and tickets are required. Fisherman's Wharf Enjoy free live performances throughout the afternoon and evening before the city's fireworks display. With waterfront restaurants, shopping, and views of the bay, it's one of the best places to spend the holiday. Sausalito After the morning parade, the celebration continues with live music at Gabrielson Park, plus food, drinks, and waterfront festivities before the evening fireworks. Napa The Oxbow Commons Festival features live entertainment from Wonderbread 5, local food vendors, family activities, and concludes with a spectacular drone show over downtown Napa. Morgan Hill Freedom Fest offers a full day of festivities with live entertainment, food vendors, classic cars, and one of the South Bay's largest fireworks shows. Celebrate the Fourth Around the Bay Whether you're watching fireworks over the Golden Gate Bridge, enjoying a hometown parade, or spending the day exploring one of the Bay Area's many festivals, there's no shortage of ways to celebrate Independence Day this year. Grab your picnic blanket, gather your friends and family, and enjoy one of the best summer weekends the Bay Area has to offer.