San Francisco Real Estate Market Report - June 2023

Jackson Salamunovich • July 18, 2023

San Francisco Real Estate Market Report – June 2023

Trends at a Glance

For single-family homes, here are the key figures for June 2023 compared with May 2023 and June 2022:


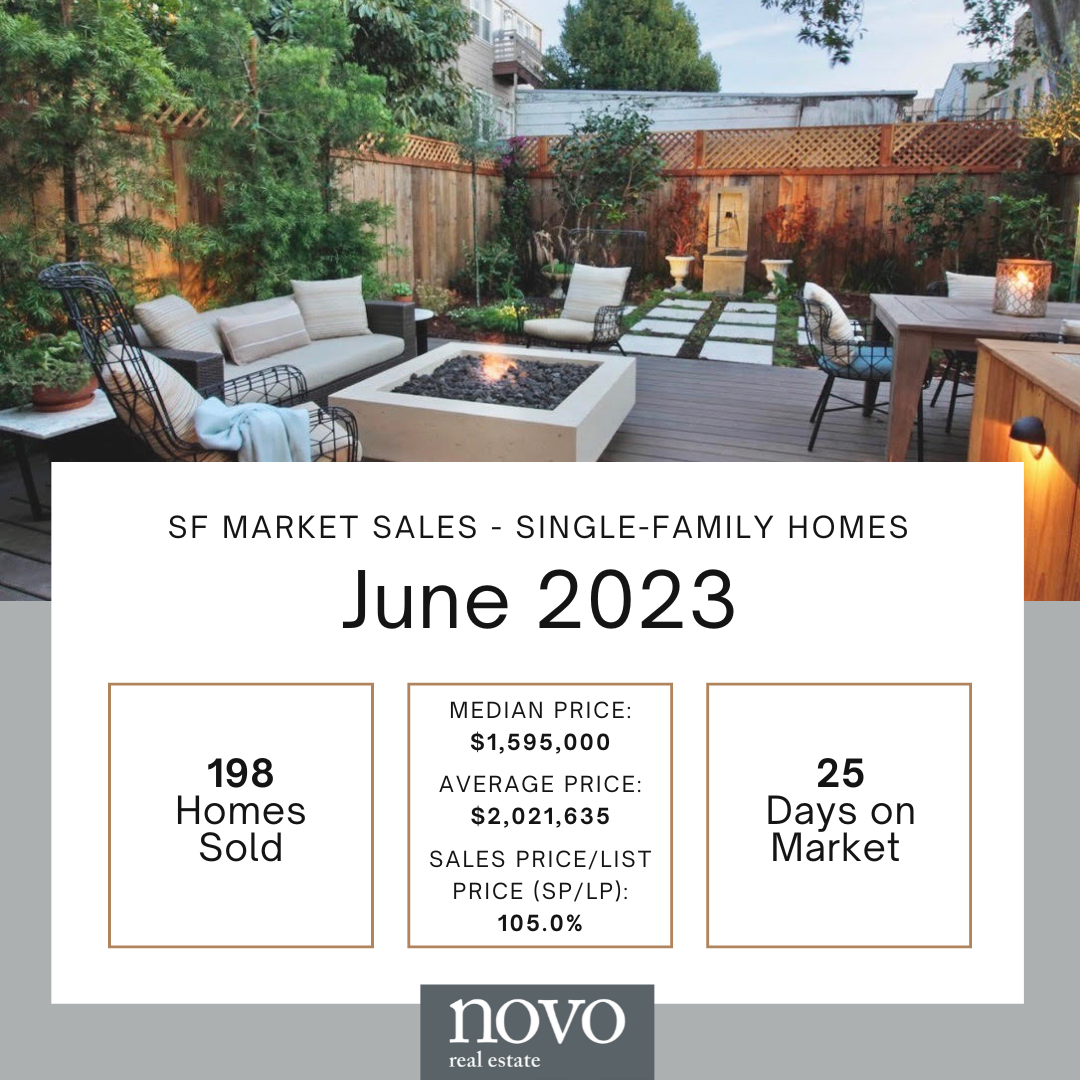
  • Home Sales: In June 2023, there were 198 home sales in San Francisco, compared to 184 in May and 230 in June 2022.
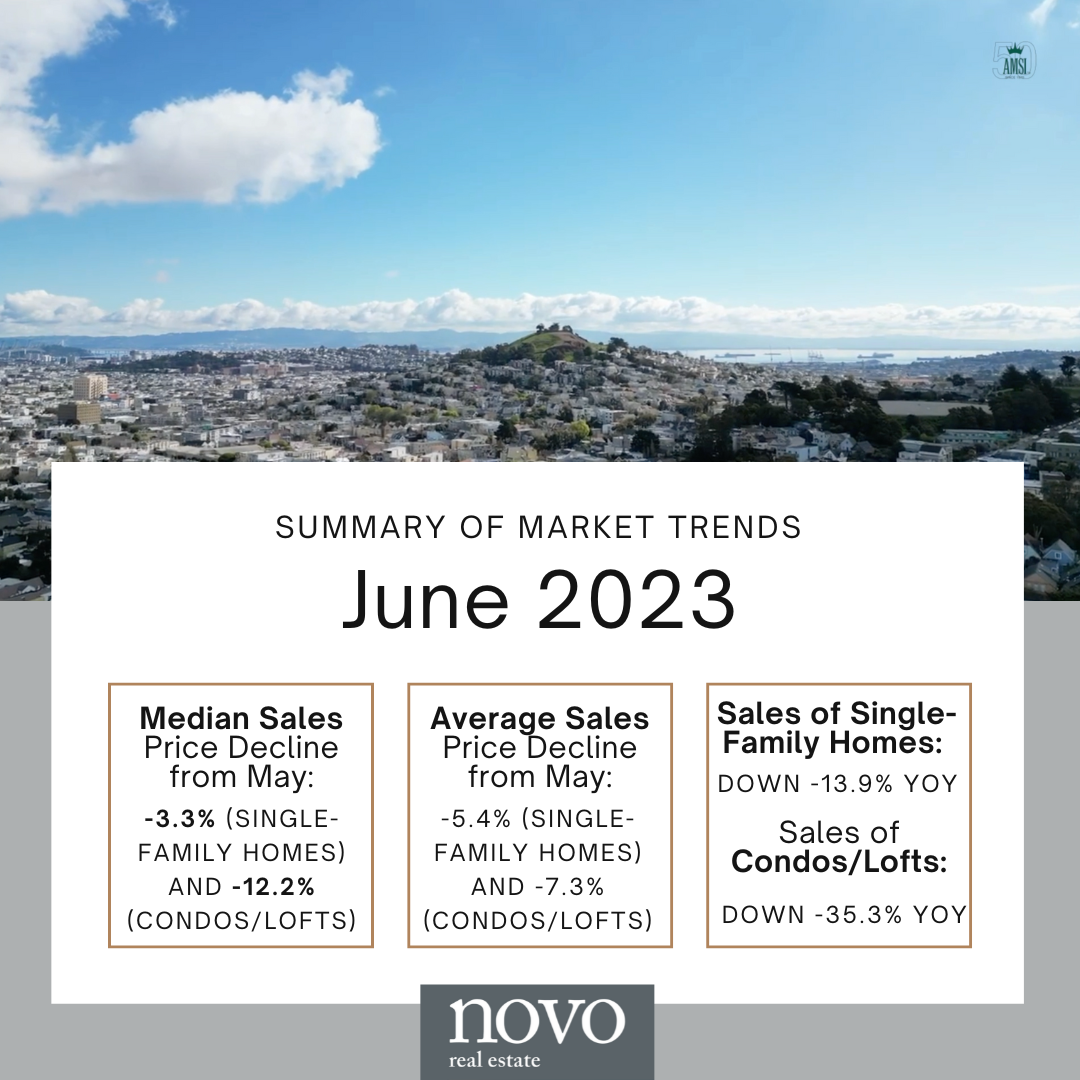
  • Median Price: The median sales price for single-family, re-sale homes in June 2023 was $1,595,000, down 3.3% from May ($1,650,000) and down 13.8% from June 2022 ($1,850,070).
  • Average Price: The average sales price for single-family, re-sale homes in June 2023 was $2,021,635, down 5.4% from May ($2,138,057) and down 10.9% from June 2022 ($2,269,212).
  • Sales Price/List Price (SP/LP): The ratio of the sales price to the list price for single-family homes rose from 104.1% in May to 105.0% in June 2023. In comparison, the SP/LP ratio was 114.4% in June 2022.
  • Days on Market: The average number of days on the market for single-family homes in June 2023 was 25, slightly shorter than 28 days in May and significantly longer than 16 days in June 2022.


For lofts, townhomes, and TICs, here are the key figures for June 2023 compared with May 2023 and June 2022:


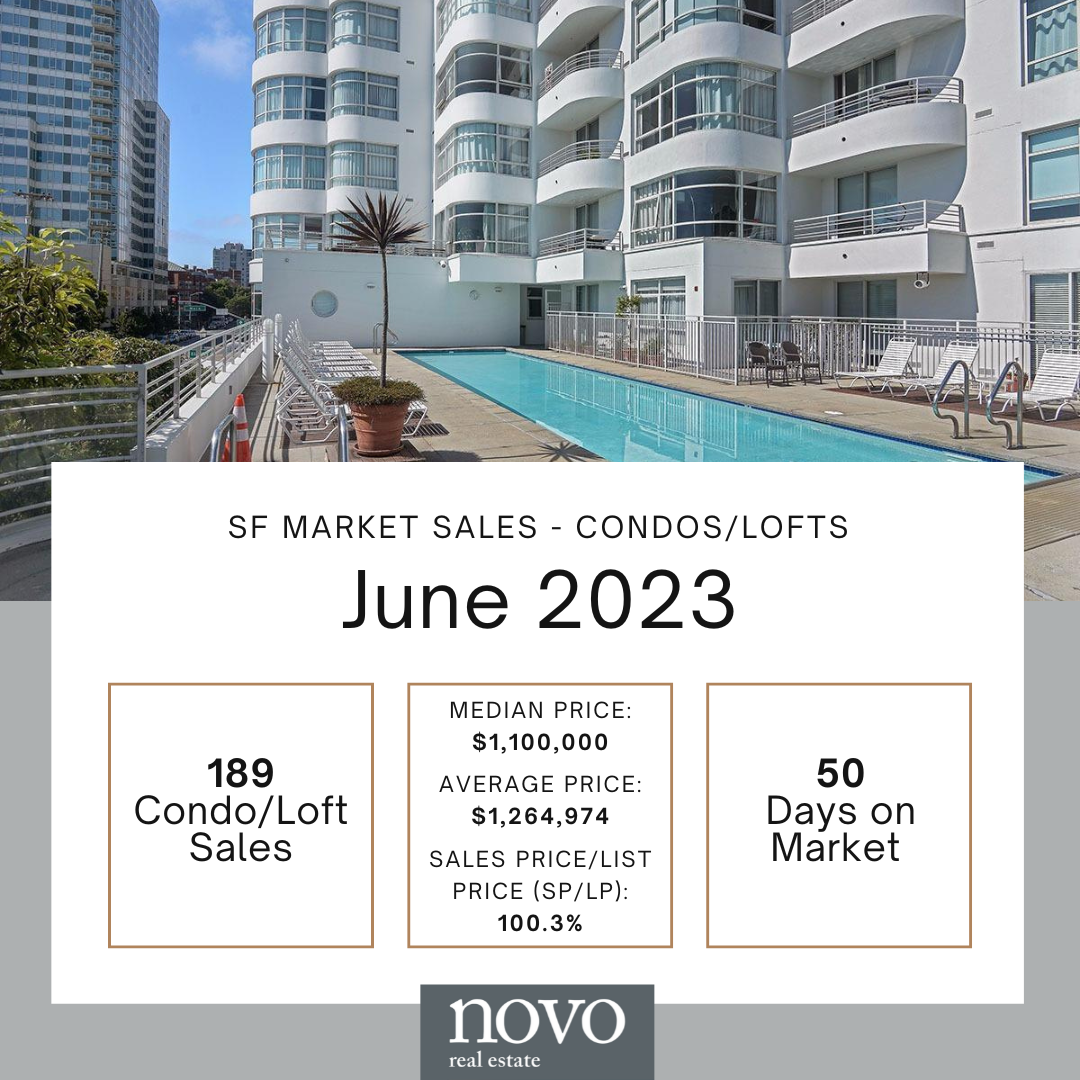
  • Condo Sales: In June 2023, there were 189 condo sales in San Francisco, compared to 221 in May and 292 in June 2022.
  • Median Price: The median sales price for condos/lofts in June 2023 was $1,100,000, down 12.2% from June 2022 ($1,252,500) and slightly lower than May ($1,150,000).
  • Average Price: The average sales price for condos/lofts in June 2023 was $1,264,974, down 7.3% from June 2022 ($1,365,157) and slightly higher than May ($1,189,507).
  • Sales Price/List Price (SP/LP): The ratio of the sales price to the list price for condos/townhomes rose from 99.9% in May to 100.3% in June 2023. In comparison, the SP/LP ratio was 105.3% in June 2022.
  • Days on Market: The average number of days on the market for condos/lofts in June 2023 was 50, compared to 56 days in May and 38 days in June 2022.


Market Analysis

The San Francisco real estate market in June 2023 continued to see a decrease in prices and sales compared to previous months and the same period last year.


For single-family, re-sale homes, the median sales price declined by 3.3% from May and was down 13.8% year-over-year. The average sales price decreased by 5.4% month-over-month and 10.9% year-over-year. Sales of single-family homes fell by 13.9% year-over-year, with 198 homes sold in San Francisco last month. It is important to note that the average number of homes sold per month since 2000 is 214.


The condo/loft market showed a similar trend, with the median sales price down 12.2% year-over-year and the average sales price down 7.3% year-over-year. Sales of condos/lofts fell by 35.3% year-over-year, with 189 units sold in June. The average number of units sold per month since 2000 is 230.


The sales price to list price ratio increased slightly for homes, indicating that buyers were paying slightly more over the listed price. However, for condos/townhomes, the ratio also rose but remained close to 100%.

The average days on market for homes increased to 25 days, indicating a slightly longer period from listing to contract. For condos/lofts, the average days on market increased to 50 days.


Momentum Statistics

Sales momentum for homes showed a slight improvement, rising from -45.9 to -44.3. This indicates a slight increase in sales activity compared to the previous period. However, sales momentum for condos/lofts decreased by 0.4 of a point to -67.7, suggesting a decline in sales activity for this segment.


Pricing momentum for single-family homes fell 1 point to -17.5, indicating a downward trend in pricing. Similarly, pricing momentum for condos/lofts fell by 1.3 points to -9.4.


Please note that these momentum statistics are based on 12-month moving averages to eliminate monthly and seasonal variations.


If you are planning on selling your property, please call us for a free comparative market analysis to help you understand the current market conditions and determine the optimal selling strategy.


For the full online report, you can access it here.


To read/print the complete monthly report, click here.


Thank you for staying informed about the San Francisco real estate market. Feel free to reach out to us with any questions and further assistance.


Information based on the 'The Real Estate Report of Local Market Trends for San Francisco' by Robb Fleischer, Broker/Officer for AMSI and Novo Real Estate Services.

By Sydney Winstead December 12, 2025
*Rendering © Bjarke Ingels Group* Updated plans have been released for 35 South Second Street in Downtown San Jose, a mixed-use development designed by Bjarke Ingels Group (BIG) . The project, referred to as the Fountain Alley development , is scheduled for review by the San Jose Planning Director and reflects a shift from an earlier office-and-housing proposal to a predominantly residential program. Project Overview The revised plans call for two residential towers, rising 27 and 28 stories , with a total of 768 apartments and ground-floor retail. The development is part of a broader downtown San Jose master plan led by Westbank and Urban Community , which includes multiple residential and mixed-use sites throughout the city. The project will span approximately 831,600 square feet , including residential units, ground-floor retail, and basement parking. Bicycle parking is planned for 417 spaces, with vehicular parking located in a multi-level subterranean garage. Change in Use Earlier versions of the project included a stronger emphasis on office space. The updated proposal reflects a reconfiguration toward residential use, consistent with other recent revisions within the larger Westbank and Urban Community portfolio in downtown San Jose. A related site at 180 Park Avenue began demolition and excavation in 2022, though work was paused due to an archaeological discovery. Recent reporting indicates that plans for that site have also been revised to focus on residential units rather than office development. Design and Site Details BIG is serving as the project architect, with Bionic as the landscape architect. Renderings show residential towers with balconies, integrated landscaping, and a pedestrian-oriented plaza connecting South Second Street with surrounding streets. Exterior materials are expected to include aluminum, terracotta-toned glass-fiber-reinforced concrete, and curtainwall glass. The development site occupies approximately 1.25 acres along South Second Street, between Santa Clara Street and San Fernando Street, near the Bank of Italy Tower. Housing Mix and Affordability The project is proposed to include: 177 studios 413 one-bedroom units 152 two-bedroom units 26 three-bedroom units Approximately 5% of the units will be deed-restricted for very low-income households, utilizing California’s State Density Bonus law . Next Steps The project is scheduled for review at a Planning Director Hearing on Wednesday, December 17 , to be held virtually via Zoom with opportunities for public comment. Read more and see renderings here ➡ SF YIMBY
By Sydney Winstead December 11, 2025
New data from RentCafe shows rising competition across San Francisco, Silicon Valley, and the East Bay, with the region’s expanding artificial intelligence sector , tech hiring, and return-to-office trends contributing to stronger rental demand in 2025. Silicon Valley Leads the Region in Rental Demand Silicon Valley recorded the fastest leasing pace in the Bay Area, with apartments renting in an average of 36 days. Comparatively: San Francisco: 42 days East Bay: 44 days Silicon Valley also had the region’s highest occupancy rate at 95.5% , followed by: San Francisco: 94.6% East Bay: 94.1% Applicant demand reflects a competitive landscape shaped in part by continued AI industry expansion: Silicon Valley: 13 applicants per unit San Francisco: 11 applicants East Bay: 10 applicants Slow Construction and High-Tech Job Growth Intensify Competition Apartment inventory growth remains limited throughout the Bay Area: San Francisco: 1.43% growth East Bay: 1.63% Silicon Valley: 2.45% RentCafe notes that reduced construction activity, combined with strong demand generated by AI startups , machine-learning companies , and major tech employers expanding teams , is contributing to a tighter rental market. More Renters Staying in Place Lease renewal rates increased across the region: Silicon Valley: 56.3% East Bay: 52.6% San Francisco: 49.6% Higher renewal rates mean fewer units entering the market — a pressure point amplified by Bay Area job growth in artificial intelligence , software engineering , and cloud computing sectors . Bay Area Performance in National Rankings RentCafe’s 2025 national report shows: Silicon Valley ranked 13th hottest rental market in the U.S. San Francisco ranked No. 42 , up 23 spots from 2024. East Bay ranked No. 53 , up two spots. San Francisco was also identified as the second fastest-rising rental market nationwide, driven by increasing demand from tech and AI professionals , expanding AI research hubs, and larger in-office presence across major employers. How RentCafe Defines the Bay Area Regions San Francisco Region: San Mateo, Redwood City, San Rafael, Petaluma East Bay: Oakland, Walnut Creek, San Ramon, Vacaville Silicon Valley: Palo Alto, Mountain View, San Jose  Read more about the rental demand here!
By Sydney Winstead December 3, 2025
Built in the Bay: Tracking San Francisco’s Growth and Transformation
By Sydney Winstead December 2, 2025
Oakland Ranked the No. 1 Best Food City in America — Bay Area Dominates Condé Nast Traveler’s 2025 List
By Sydney Winstead November 26, 2025
AI-driven wealth fuels record-breaking demand in the Bay Area’s high-end housing market
By Sydney Winstead November 19, 2025
San Francisco Holiday Guide 2025: Best Christmas Events, Lights, Ice Rinks & Pop-Ups
By Sydney Winstead November 18, 2025
After months of disputes, the city is taking a hard stance — and pickleball players aren’t happy.
By Sydney Winstead November 14, 2025
Your Weekly Dose of San Diego
By Sydney Winstead November 14, 2025
Top Things To Do in San Francisco This Weekend
By Sydney Winstead November 14, 2025
Holiday Events in San Diego: Your 2025 Guide San Diego comes alive during the holiday season with festive pop-ups, tree lightings, markets, and coastal celebrations. Whether you’re exploring the city as a visitor or a local, here’s a curated roundup of holiday happenings across the region.